
Most trading dashboards bury the data you really need under layers of confusing charts and jargon. If you’ve felt lost trying to track your real-time PnL or understand drawdown explained, you’re not alone. The Trading Hub’s live performance dashboard cuts through the noise, showing clear forex performance metrics that matter—so you can see your equity curve, risk per trade, and win rate without guessing. Let’s break down what every trading dashboard should deliver, in plain English. Learn more about building a live performance dashboard here.
Essential Metrics for Trading Dashboards
To make informed decisions, you need a clear view of your trading metrics. Let’s dive into the essential elements that a robust trading dashboard should provide.
Equity Curve and Balance Insights
Your equity curve doesn’t just show how much you’ve gained or lost over time. It reveals how your trading strategy performs in different market conditions. A steady upward curve suggests consistency, while frequent dips might indicate volatility.
Balance insights give you a snapshot of your current financial standing. They help you assess your available capital and adjust your trades accordingly. By understanding these metrics, you’re better equipped to manage your risk and optimize your trades.
Real-Time PnL and Open Risk
Knowing your real-time PnL (Profit and Loss) is crucial. It lets you see your current earnings or losses instantly. This transparency helps you make quick decisions to capitalize on or mitigate risks. Open risk shows the potential loss if all current trades were to be closed immediately. Monitoring these metrics ensures you stay on top of your trading strategy.
Drawdown Explained for Risk Management
Understanding drawdown is essential for effective risk management. Drawdown measures the decline from a peak to a trough of your account balance. It’s a critical metric that highlights your risk exposure. By keeping your drawdown low, you safeguard your capital, ensuring you can trade another day.
Key Performance Indicators
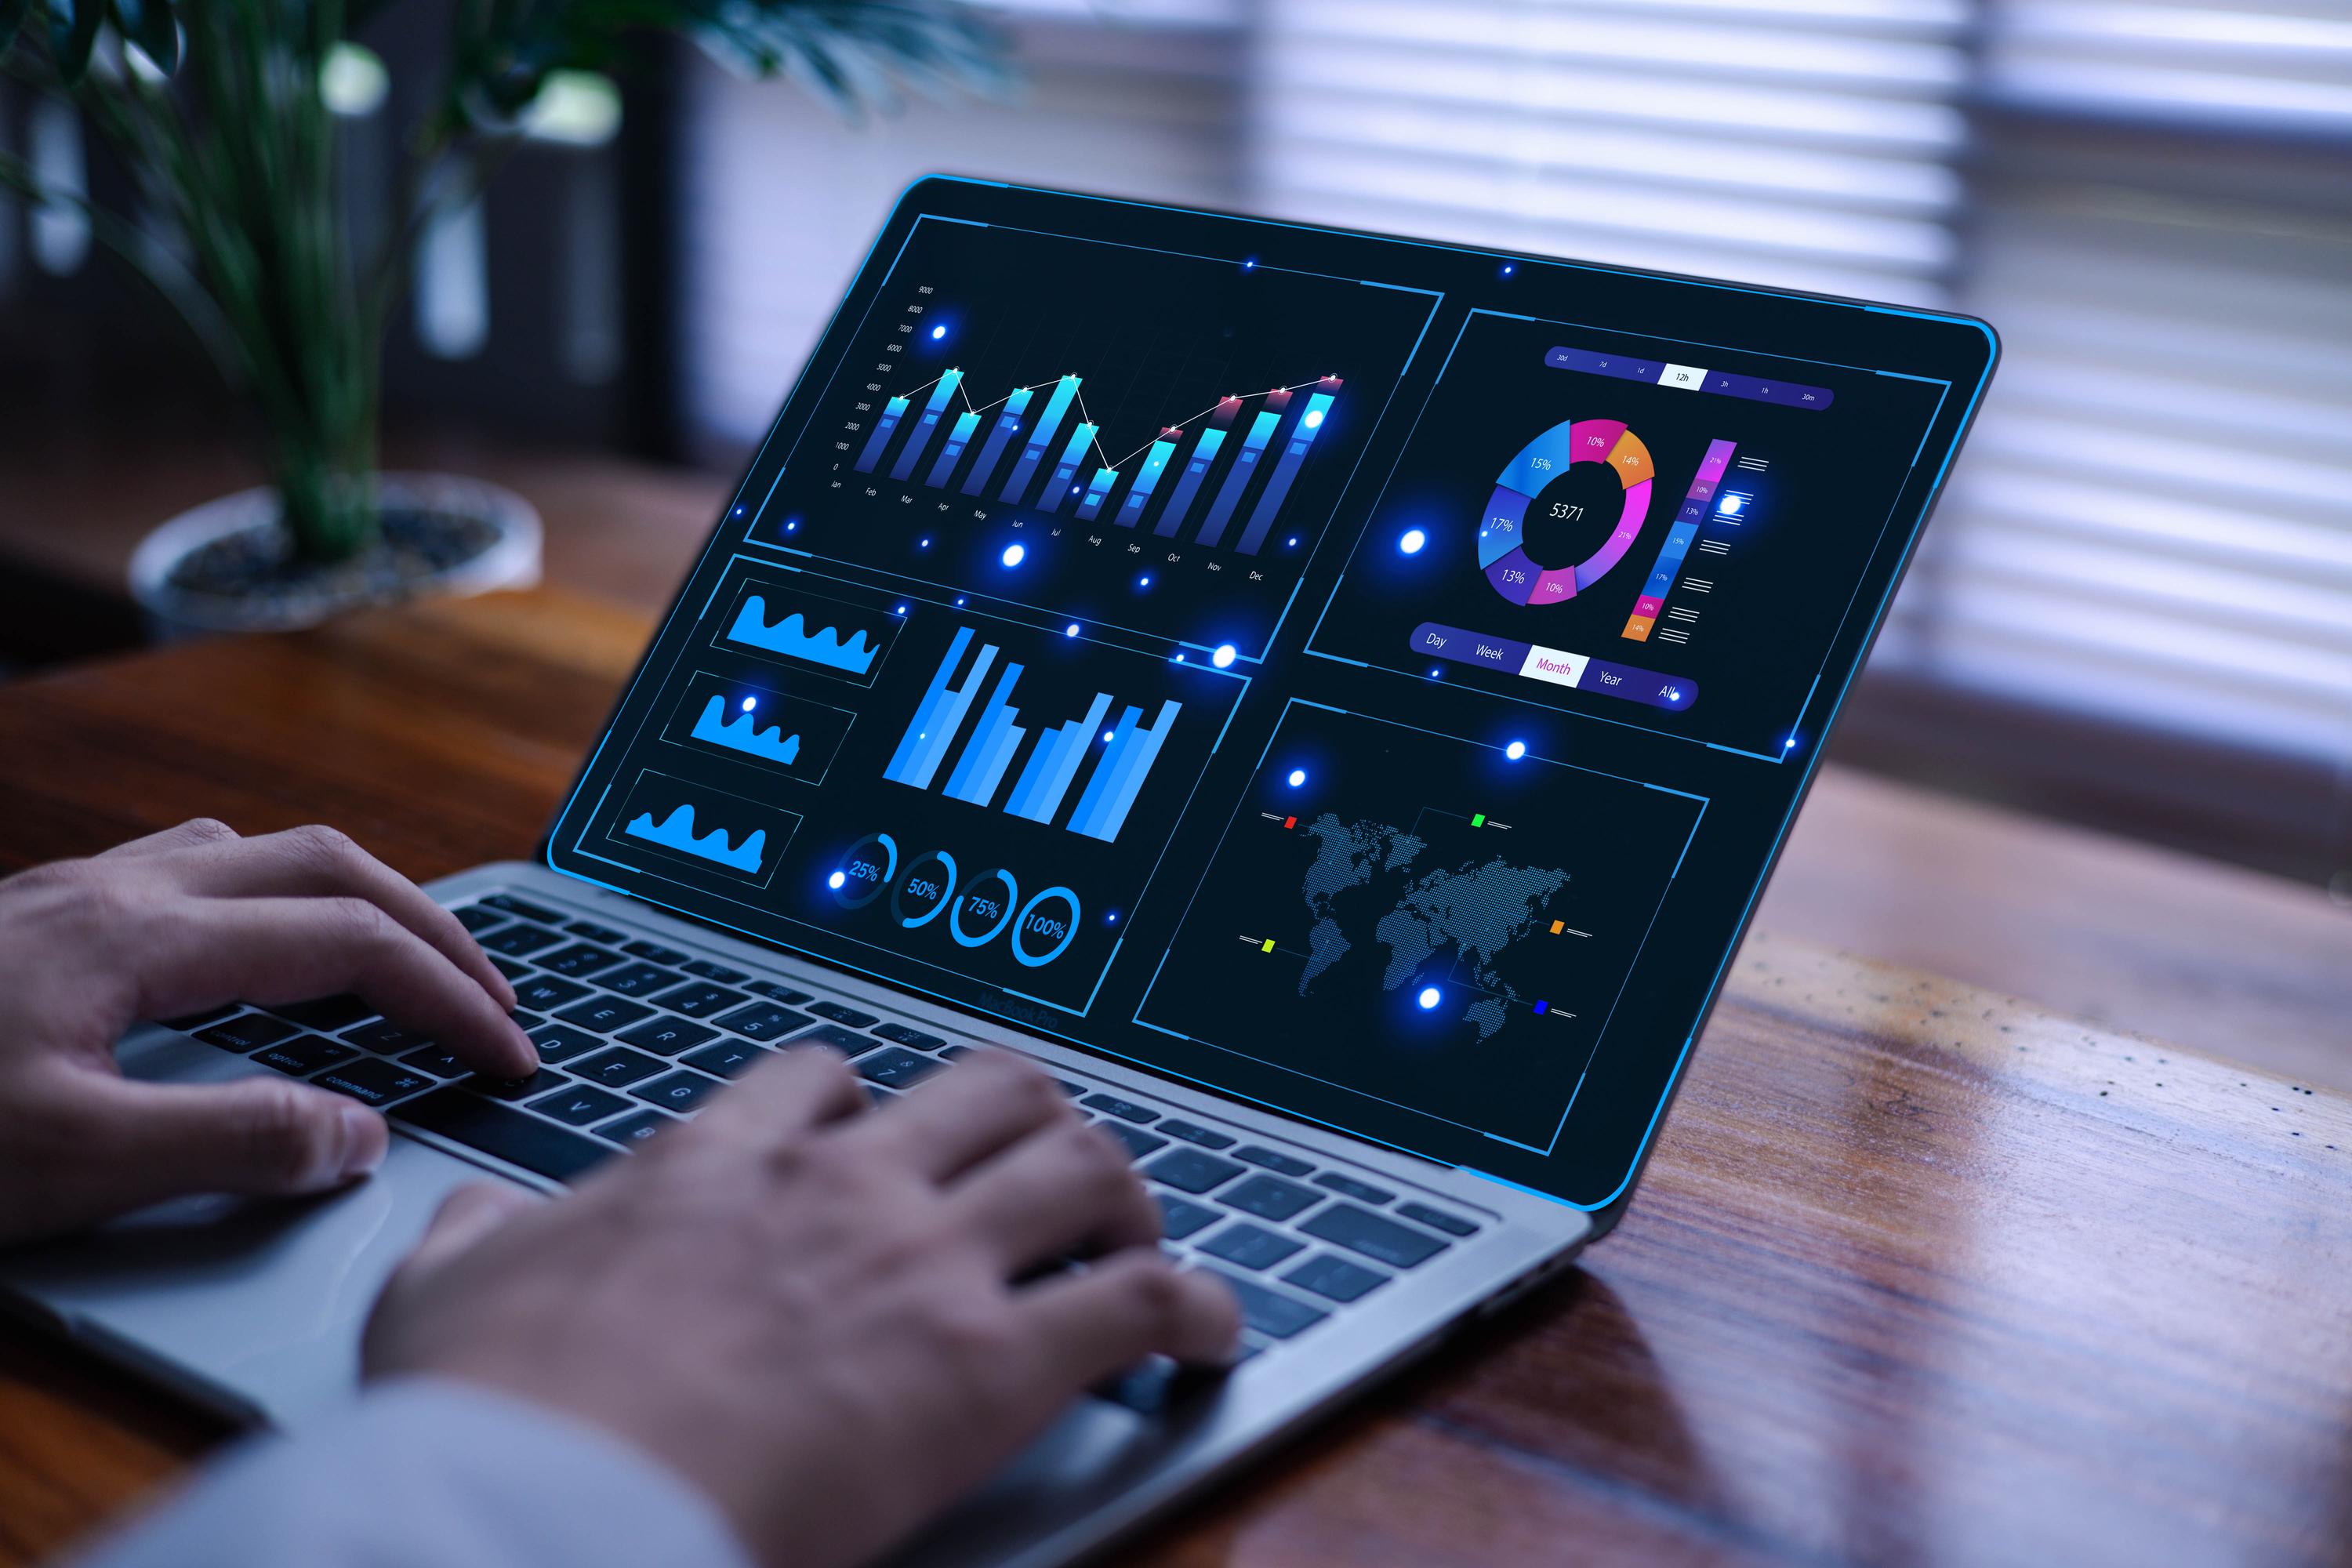
Key Performance Indicators (KPIs) are the backbone of your trading success. They offer a comprehensive view of your trading effectiveness.
Win Rate and Expectancy
Win rate is the percentage of trades that result in a profit. While a high win rate is desirable, it’s not the only factor. Expectancy tells you the average amount you can expect to win or lose per trade. Together, these metrics paint a clearer picture of your trading strategy’s overall effectiveness.
Risk Per Trade and Position Sizing
Risk per trade is the amount you’re willing to lose on a single trade. Position sizing determines how much of your capital you invest in each trade. Balancing these metrics ensures you’re not overexposing your account to risk. They help maintain a disciplined trading approach.
Exposure by Asset and Session Analysis
Exposure by asset shows how much of your capital is invested in specific assets. Session analysis reveals how your trades perform across different trading sessions. By analyzing these metrics, you can optimize your strategy to focus on the most profitable assets and sessions.
Transparency and Strategy Tracking

Transparency and strategy tracking are vital for sustained trading success. They provide clarity and accountability in your trading journey.
Trade History Transparency
Your trade history should be a detailed record of every transaction. It helps you analyze past trades, understand mistakes, and refine your strategy. Transparent trade history fosters trust and confidence in your trading decisions.
Strategy Diversification and Performance
Diversifying your trading strategy reduces risk and increases potential returns. By tracking your strategy’s performance, you identify what’s working and what’s not. This insight allows you to make necessary adjustments for better outcomes.
HALO AI and Autonomous Trading Benefits
HALO AI offers a unique advantage with its autonomous trading capabilities. It uses real-time data and intelligent algorithms to execute trades without emotional interference. This hands-free approach lets you focus on strategy, knowing that HALO AI handles execution with precision and efficiency.
Frequently Asked Questions
What is an equity curve, and why does it matter?
An equity curve tracks the value of your trading account over time. It helps you visualize your trading performance and identify patterns or trends, allowing for better strategy adjustments.
How can I calculate my risk per trade?
To calculate risk per trade, determine the percentage of your account you’re willing to risk, then multiply it by your account balance. This helps ensure controlled risk exposure in each trade.
What makes HALO AI different from other trading algorithms?
HALO AI stands out due to its real-time data analysis, adaptive learning, and emotion-free execution. It offers a hands-free approach to trading, allowing you to focus on strategy without worrying about execution.