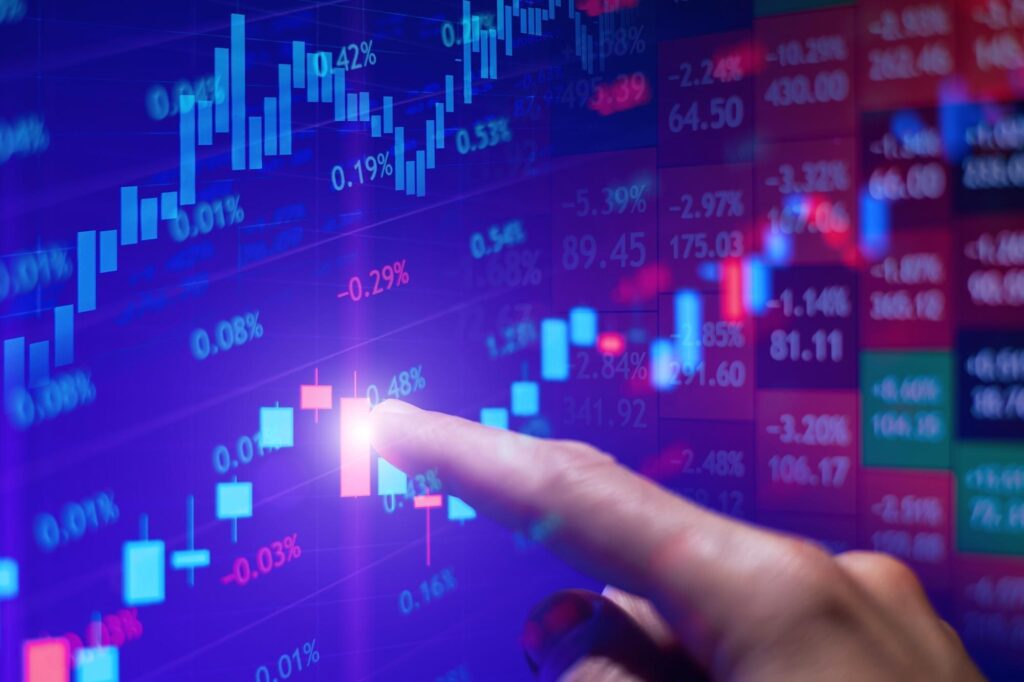
Most dashboards show a flood of numbers that leave you guessing about your real risk and performance. Your trading deserves clarity, not confusion. This checklist reveals the exact real-time trading metrics your live trading dashboard must deliver—so you see your true PnL, drawdown, execution quality, and risk at a glance. Ready to trade with transparency and confidence? https://conversation.thetradinghub.com/what-a-live-trading-dashboard-should-include-a-practical-transparent-checklist/
Essential Metrics for Traders
Understanding these essential metrics is crucial for anyone in the trading world. They not only offer insights into your performance but also guide your risk management decisions.
Real-Time PnL and Equity Curve
Your real-time trading dashboard should provide a clear picture of your profit and loss (PnL) as well as your equity curve. Seeing these metrics at a glance helps you understand how your strategy is performing. You can quickly identify winning streaks and potential downturns. When adjusted for time, the equity curve can reveal trends and help in decision-making. Remember, it’s not just about winning trades—it’s about consistent performance over time.
Drawdown Monitoring and Risk Management
No trader can avoid losses, but monitoring drawdowns gives you control over them. Your dashboard should continuously track drawdowns, allowing you to quickly assess risk levels. By keeping an eye on these, you can adjust your strategy to mitigate large losses. This approach is your safety net, ensuring you protect your capital from severe downturns.
Margin, Leverage, and Exposure by Asset
Understanding your margin and leverage is key to managing risk. A trading dashboard should break down your exposure by asset, helping you see where your risks lie. By knowing your leverage levels, you can make informed decisions to avoid overextending. This insight ensures that you are trading within your risk tolerance, protecting against unnecessary exposure.
Features of a High-Quality Dashboard
A high-quality trading dashboard doesn’t just show numbers—it empowers you to make better decisions. Let’s explore the features that set a top-tier dashboard apart.
Execution Quality: Slippage and Spread
Execution quality is crucial in forex trading. An effective dashboard tracks slippage and spread, helping you evaluate the true cost of trades. By understanding these elements, you can fine-tune your strategy for better pricing. It’s about ensuring you get the best possible entry and exit points. Don’t let hidden costs eat into your profits—monitor these metrics closely.
Comprehensive Trade Log and Audit Trail
A detailed trade log is your trading history’s backbone. It provides a full audit trail, allowing you to review past decisions and refine your approach. A well-documented trade log helps highlight patterns and errors. This transparency is invaluable for continuous improvement. By regularly reviewing your trades, you can adapt and evolve your strategies.
Strategy Attribution and Diversification Metrics
Understanding which strategies work is key to long-term success. A robust dashboard offers strategy attribution, showing which methods yield the best results. Diversification metrics help you spread risk across different assets. They ensure you’re not overly reliant on a single strategy or market condition. This balanced approach increases your odds of consistent success.
Enhancing Transparency with AI
Artificial intelligence is transforming the trading landscape. Let’s dive into how AI can enhance transparency and improve your trading experience.
HALO AI Engine and Regime Detection
The HALO AI Engine stands out by analyzing real-time data to detect market regimes. This capability allows you to adapt strategies to current conditions, maximizing potential returns. By identifying trends and shifts early, you can stay ahead of the market. The AI’s adaptive nature ensures that your trading approach remains relevant and effective.
Model Confidence and Autonomous Trading
With AI-driven model confidence, you gain insights into the reliability of your strategies. This feature of HALO AI enhances decision-making by providing clear confidence levels. Autonomous trading powered by AI handles execution, letting you focus on strategy development. This hands-free approach combines precision with ease of use, offering a competitive edge.
Pricing Transparency and Demo Access
Transparency in pricing is a hallmark of trustworthy platforms. A clear understanding of costs prevents unexpected surprises. Access to demo accounts allows you to test strategies without risk, building confidence before committing real capital. This practice not only saves money but also enhances learning. By experimenting in a safe environment, you perfect your approach before going live.
Frequently Asked Questions
What should a live trading dashboard include?
A live trading dashboard should include real-time PnL, equity curve, drawdown monitoring, and insights on margin, leverage, and exposure by asset. These elements help traders manage risk and performance effectively.
How does AI enhance trading transparency?
AI enhances trading transparency by providing real-time market insights and regime detection. This allows traders to adapt strategies quickly, enhancing decision-making and execution quality.
Why is execution quality important in trading?
Execution quality, including slippage and spread, affects the true cost of trades. Monitoring these factors ensures better pricing and increases overall profitability.
What is the role of a comprehensive trade log?
A comprehensive trade log provides a full audit trail of trading activities. It allows traders to review past decisions, identify patterns, and refine strategies for better outcomes.
How do diversification metrics contribute to trading success?
Diversification metrics help spread risk across various assets and strategies. This approach reduces reliance on a single method and increases the likelihood of consistent success.